Author: James Wilkinson
-
2006 Underway Data & Figures
February 3-26, 2006 (R/V David Starr Jordan 0602JD) Data: SCIMS • SCS • CTD • Regressions • Metadata • Notes Temperature Cruise Path PDF • PNG Temperature Contour PDF • PNG Salinity Cruise Path PDF • PNG Salinity Contour PDF • PNG Chlorophyll Cruise Path PDF • PNG Chlorophyll Contour PDF • PNG April 1-18,…
-
2005 Underway Data & Figures
0501NH : January 2004, R/V New Horizon: SST, Salinity, Fluorescence, Chlorophyll SCIMS: Data • Quality Flags • Header Station Data: Data • Quality Flags • Header Cross Correlation: Data and Plots Metadeta: Data Path Plots: Temperature (PDF / PNG) • Salinity (PDF / PNG) • Fluorescence (PDF / PNG) • Chl A (PDF / PNG ) 0504NH : April 2004, R/V New Horizon : SST, Salinity, Fluorescence, Chlorophyll SCIMS: Data • Quality Flags • Header Station Data: Data • Quality…
-
2004 Underway Data & Figures
0401JD : January 2004, R/V David Starr Jordan : SST, Salinity SCIMS: Data • Quality Flags • Header Station Data: Data • Quality Flags • Header Cross Correlation: Data and Plots Metadeta: Data Path Plots: Temperature (PDF / PNG) • Salinity (PDF / PNG) 0404NH : April 2004, R/V New Horizon : SST, Salinity SCIMS: Data • Quality Flags • Header Station Data: Data • Quality Flags • Header Cross Correlation: Data and Plots Metadeta: Data Path Plots: Temperature…
-
The CalCOFI Book
Regional Fisheries Oceanography of the California Current System The CalCOFI program Author: Sam McClatchie ISBN: 978-94-007-7222-9 (Print) 978-94-007-7223-6 (Online) Download Book (21,575 KB) Academic edition pdf, courtesy of Springer Publishing. To order a soft or hard cover book, click here. The origin of CalCOFI through the decline of the Pacific sardine fishery Created in the…
-

Drifter Buoys
The Institute for Computational Earth System Science (ICESS) utilizes Pacific Gyre GPS/ Mobitex™ “Microstar” drifters to observe and study near-shore ocean circulation off the Southern California coast. The drifters record their position with GPS every 10 minutes and transmit their position data in near real-time to a web-based host computer using the Mobitex narrow band,…
-

SCCOOS Information
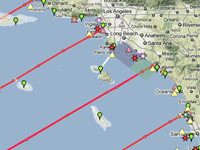
Southern California Coastal Ocean Observing System (website) SCCOOS brings together coastal observations in the Southern California Bight to provide information necessary to address issues in climate change, ecosystem preservation and management, coastal water quality, maritime operations, coastal hazards and national security. In 2004, CalCOFI added 9 SCCOOS stations to the standard 66 station pattern. Stations…
-
SCCOOS Data
SCCOOS Station Occupation on CalCOFI cruises from 2004 to present Cruise 80.0 50.5 81.7 43.5 83.3 39.4 85.4 35.8 86.8 32.5 88.5 30.1 90.0 27.7 91.7 26.4 93.4 26.4 202010 X X X X X X X X X 202007 X X X X X X X X X 202005 202001 X X X…
-
SCCOOS Stations
SCCOOS brings together coastal observations in the Southern California Bight to provide information necessary to address issues in climate change, ecosystem preservation and management, coastal water quality, maritime operations, coastal hazards and national security. As a science-based decision support system, SCCOOS works interactively with local, state and federal agencies, resource managers, industry, policy makers, educators,…
-
Net Sampling
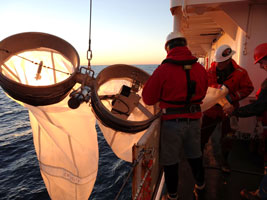
Net Sampling Ichthyoplankton sampling is done on all survey cruises and processing of these samples is done at the Southwest Fisheries Science Center (SWFSC) laboratory in La Jolla, California. There, plankton displacement volumes are obtained for each sample and the fish eggs, larvae, and juveniles are separated from the invertebrate zooplankton, and subsequently identified, staged,…
-
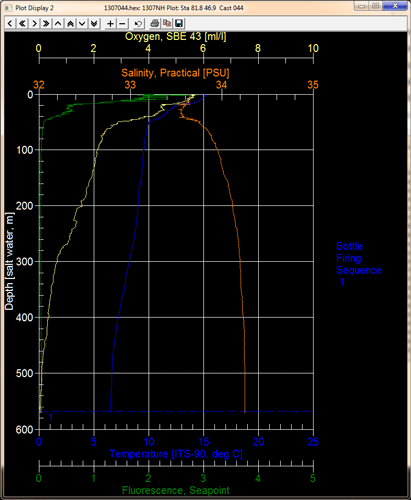
CTD Profiling
CalCOFI collects vertical profile data using Sea-bird Scientific software (Seasave V7) and a Seabird 911plusV2 CTD and deck unit. Our SBE 911plus CTD system includes: 9plus Underwater Unit and a 11plus V2 Deck Unit. Current sensor complement includes: • Dual Temperature – SBE 3plus • Dual Conductivity – SBE 4 • Dual Oxygen – SBE 43 •…